Here we will learn about straight line graphs including how to draw straight lines graphs of the form y = mx + c by using a table and from a pair of coordinates. We will learn how to calculate the gradient of a straight line including parallel and perpendicular lines, and how to quickly sketch a straight line graph with limited information.
There are also straight line graphs worksheets based on Edexcel, AQA and OCR exam questions, along with further guidance on where to go next if you’re still stuck.
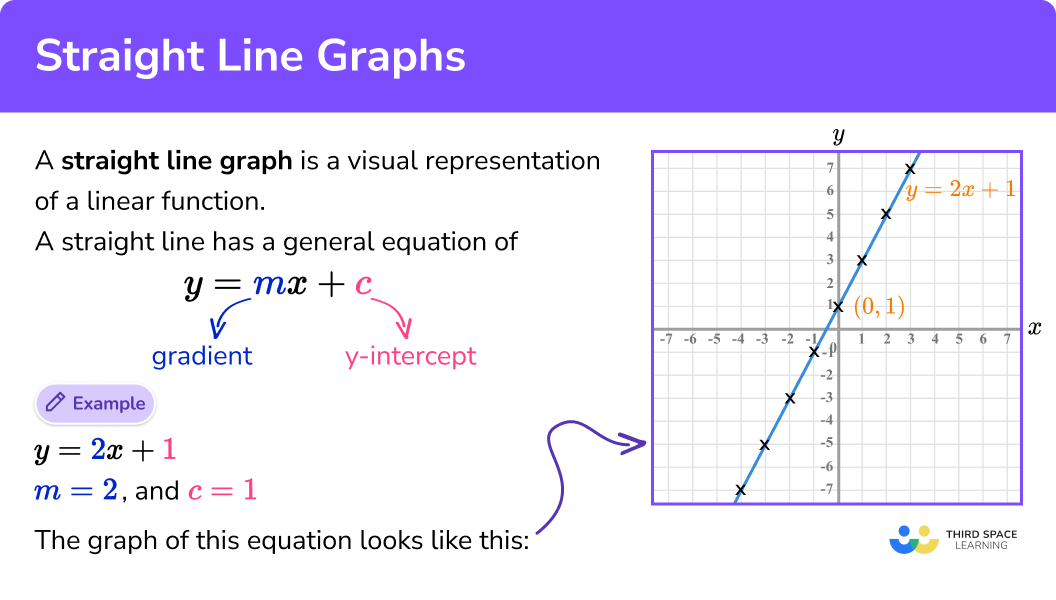
A straight line graph is a visual representation of a linear function. It has a general equation of:
Where m is the gradient of the line
And c is the y intercept.
Here we can see that the gradient = 2 , and the y -intercept happens at (0,1) .
The graph of this equation looks like this:
Highlighted on the graph are several important values that you must be able to label on any straight line graph.
In order to plot straight line graphs we need to substitute values for x into the equation for the graph and work out the corresponding values for y .
We often put these values in a table to make our work clearer. Once we have calculated the coordinates, we can plot these as a graph.
Example
Complete the table to plot the graph of the equation.
| x | -2 | -1 | 0 | 1 | 2 | 3 | 4 |
|---|---|---|---|---|---|---|---|
| y=x+4 | 5 | 7 | 8 |
Here we need to substitute the values of x in the table to calculate the values for y .
| x | -2 | -1 | 0 | 1 | 2 | 3 | 4 |
|---|---|---|---|---|---|---|---|
| y=x+4 | y=-2+4 y=2 | y=-1+4 y=3 | y=0+4 y=4 | 5 | y=2+4 y=6 | 7 | 8 |
2 Plot the resulting coordinates onto a set of labelled axes.
As a coordinate is written as (x,y) , from the table we now have the coordinates (-2,2), (-1,3), (0,4), (1,5), (2,6), (3,7), and (4,8) which we can plot:
3 Draw a straight line through all the plotted coordinates across the whole plotting area.
Top tip: don’t forget to label the line as the equation in the question. Here we have labelled the straight line y = x + 4 .
Step-by-step guide: Equation of a line
Sometimes, we only need a sketch of a straight line graph – we don’t need it to be plotted with the same accuracy as we would get by calculating coordinates.
The sketched graph should include certain information such as labelled axes, a labelled line and the points where the line crosses the axes.
Let’s compare a poor sketch with a good sketch of the straight line y=2x+1
Poor sketch
Although the line does have a positive gradient and intersects the y -axis at one point, the graph assumes that there are only positive values of x . Also nothing on the graph is labelled.
Good sketch
The key parts to pick out from the image above are:
The midpoint of a line segment is a point that lies exactly halfway between two points. It is the same distance from each endpoint of the straight line segment.
We find the midpoint of a line segment by finding the average of the x coordinates and the average of the y coordinates of the two endpoints.
For example, for the points (4, 6) and (8, 2):
Average of x coordinates =\frac=\frac=6
Average of y coordinates =\frac=\frac=4
So the coordinates of the midpoint are (6, 4).
The gradient of a line tells us how steep a line is. It tells us how many steps the line goes up for every one it goes across. Therefore, the higher the gradient, the steeper the line.
If the gradient is negative, the line goes down rather than up (from left to right).
Example:
Calculate the gradient of the straight line in the diagram.
Locating two coordinates that pass through the corners of the grid squares, we have the coordinates (0,1) and (4,7) .
2 Find the change in y and the change in x .
The change in y is equal to y_2 − y_1 = 7 − 1 = 6 .
The change in x is equal to x_2 − x_1 = 4 − 0 = 4 .
3 Here
So the gradient of the line is m=\frac .
Step-by-step guide: Gradient of a line
The general equation for a straight line is y=mx+c , where m is the gradient and c is the y intercept.
We can find the equation of a straight line by finding the gradient and the y intercept and then using these values in the equation.
Example:
The two coordinates A (3,5) and B (5,11) lie on the same straight line L. Use these coordinates to find the equation of line L.
So the gradient m = 3
2 Calculate the y -intercept of the straight line.
When y = 3x + c at A (3,5) ,
So the y -intercept is at (0,−4) .
3 State the equation of the straight line.
Step-by-step guide: y=mx+c
Parallel lines are lines that go in exactly the same direction and therefore never meet.
The gradients of parallel lines are equal.
Perpendicular lines are lines that cross at 90^o to each other.
The gradients of perpendicular lines multiply together to make -1 (they are negative reciprocals of each other).
Example:
Show that the two lines y = 6 - 4x and 4y = x are perpendicular.
Here we have y = -4x + 6 and y = \fracx .
2 State the gradient of each line.
3 Multiply the gradients together. If they equal −1 , the two lines are perpendicular.
Yes they are perpendicular.
Step-by-step guide: Linear graph
In order to plot a straight line graph:
Get your free straight line graphs worksheet of 20+ questions and answers. Includes reasoning and applied questions.
Get your free straight line graphs worksheet of 20+ questions and answers. Includes reasoning and applied questions.
Plot the graph of the equation y=2x-3
| x | -2 | -1 | 0 | 1 | 2 |
|---|---|---|---|---|---|
| y=-x+4 | -5 |
Substitute each given value for x into the general equation of a straight line.
| x | -2 | -1 | 0 | 1 | 2 |
|---|---|---|---|---|---|
| y=2x-3 | y = (2 × −2) − 3 y = −4 − 3 y = −7 | -5 | y = (2 ×0 ) − 3 y = 0 − 3 y = − 3 | y = (2 × 1) − 3 y = 2 − 3 y = −1 | y = (2 × 2) − 3 y = 4 − 3 y = 1 |
Plot the resulting coordinates onto a set of labelled axes.
We now have the following coordinates to plot on a set of axes:
Draw a straight line through all the plotted coordinates across the whole plotting area.
Plot the graph of the equation on the set of axes below.
Substitute each given value for x into the general equation of a straight line.
Here we do not have a table to complete, so we need to choose values for x that appear on the set of axes. Remember that the more points you can plot, the more likely your straight line will be correct. Here, we will choose the values of x to be 0, 1, and 2 .
So we have the coordinate (0,−2) .
So we have the coordinate (1, -1\frac).
So we have the coordinate (2,−1) .
We now have the three coordinates: (0,−2), (1, −1\frac) and (2,−1) .
Plot the resulting coordinates onto a set of labelled axes.
Draw a straight line through all the plotted coordinates across the whole plotting area.
Plot the graph of the equation below on the given set of axes for -2\leq\leq2.
Substitute each given value for x into the general equation of a straight line.
First we need to rearrange the equation 2y = 4x + 6 to make y the subject. This will make calculating the values for y more straightforward.
To make y the subject:
Now we can substitute in values for x into y = 2x + 3 to find the respective y coordinate.
Here, we will draw a table for y = 2x + 3 for the range of values -2\leq\leq2.
| x | -2 | -1 | 0 | 1 | 2 |
|---|---|---|---|---|---|
| y | y=(2 × −2) +3 y = −4 + 3 y = −1 | y=(2 × −1) +3 y = −2 + 3 y = 1 | y=(2 × 0) +3 y = 0 + 3 y = 3 | y=(2 × 1) +3 y = 2 + 3 y = 5 | y=(2 × 2) +3 y = 4 + 3 y = 7 |
Plot the resulting coordinates onto a set of labelled axes.
We now have the coordinates: (−2,−1), (−1,1), (0,3), (1,5), and (2,7) .
Draw a straight line through all the plotted coordinates across the whole plotting area.
Complete the table to plot the graph of the equation.
| x | -2 | -1 | 0 | 1 | 2 |
|---|---|---|---|---|---|
| y | 1 |
Substitute each given value for x into the general equation of a straight line.
| x | -2 | -1 | 0 | 1 | 2 |
|---|---|---|---|---|---|
| y | y = (−4 × −2) + 1 y = 8 + 1 y = 9 | y = (−4 × −1) + 1 y = 4 + 1 y = 5 | 1 | y = (−4 × 1) + 1 y = −4 + 1 y = −3 | y = −4 × 2) + 1 y = −8 + 1 y = −7 |
Plot the resulting coordinates onto a set of labelled axes.
We now have the coordinates: (−2,9), (−1,5), (0,1), (1,−3), and (2,−7) .
Draw a straight line through all the plotted coordinates across the whole plotting area.
Plot the graph of the equation for -1\leq\leq3.
Substitute each given value for x into the general equation of a straight line.
First we need to rearrange the equation 3x + y = 2 to make y the subject.
To make y the subject:
Now we can substitute in values for x into y = −3x + 2 to find the respective y coordinate. Here, we will draw a table for y = −3x + 2 for the range of values -1\leq\leq3.
| x | -1 | 0 | 1 | 2 | 3 |
|---|---|---|---|---|---|
| y | y = (−3 × −1) + 2 y = 3 + 2 y = 5 | y = (−3 × 0) + 2 y = 0 + 2 y = 2 | y = (−3 × 1) + 2 y = -3 + 2 y = -1 | y = (−3 × 2) + 2 y = -6 + 2 y = -4 | y = (−3 × 3) + 2 y = -9 + 2 y = -7 |
Plot the resulting coordinates onto a set of labelled axes.
We now have the following coordinates for the line 3x + y = 2: (-1,5), (0,2), (1,-1), (2,-4), (3,-7)
Draw a straight line through all the plotted coordinates across the whole plotting area.
A straight line is continuous. If you join the coordinates on the set of axes only, you are only drawing part of the line. Make sure the graph is extended across the entire grid. See below for a visual description:
The scale on each axis is linear which means that every unit has a set distance. When you are writing a scale onto a set of axes, make sure each unit is the same number of grid squares from the next, this is very important around the origin. See below for a visual representation of multiple misconceptions with labelling axes:
This is not necessarily a misconception but the reason why you should always use a ruler is because you are drawing a single straight line, with no breaks, kinks or curves. A straight line is a straight line!
Sometimes you have generated a coordinate that does not lie in the expected position on the straight line. This can mean one of two things: a) the substitution hasn’t been calculated correctly, b) the coordinate is not plotted correctly.
To resolve this, have a look where the coordinate is supposed to lie using your straight line to help you and check the plotting of the coordinate, and then the substitution.
A coordinate on a cartesian grid has the general form (x, y) . Make sure that when you are generating your coordinates, the x value appears first in the bracket, followed by the y value that has been calculated.
1. Which of these tables shows the correct values for the line y=6x-8?